Inverted Hammer Candlestick,
Candlestick Chart and Inverted Hammer Explanation
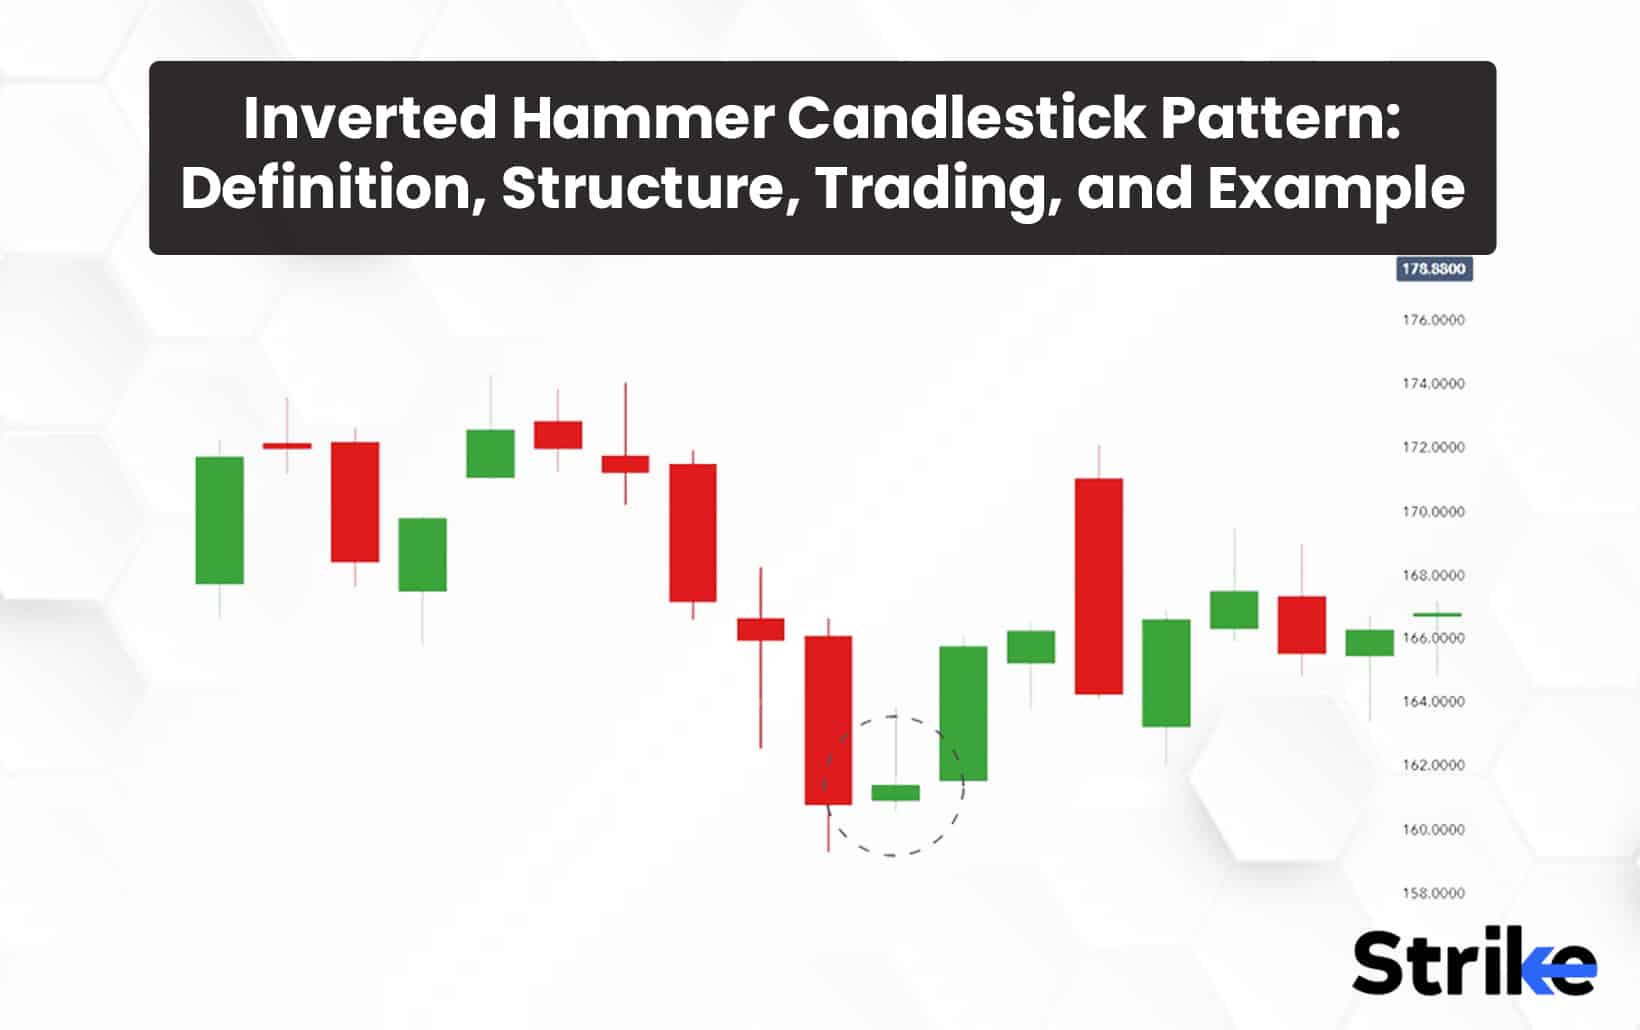
Candlestick charts are used for trading and market analysis. Inverted Hammer is a candlestick pattern that indicates a market trend reversal. Nose trade execution, which is a pattern-based trading strategy, helps traders understand market dynamics.
Inverted Hammer is a reversal candlestick pattern that signals the market's bearish trend. Iski pehchan lambi upper shadow aur chhoti body ke zariye hoti hai, jo ki market mein buyers and sellers ke darmiyan taqat ka tasawwur deti. If the opening and closing prices of a pattern are close to each other, then the high price will be in the upper shadow.

Definition of an Inverted Hammer Candlestick.
Inverted Hammer candlestick pattern trading mein focus hota hai. Inverted Hammer body ke center point par, jo ke nose kehlata hai. If the closing price is higher than the opening price, it is a bullish signal; otherwise, it is a bearish signal.Pehle traders ko Inverted Hammer se pehchanne ki zarurat hai. Iski pehchan upper shadow ki lambai & body ki chhotai par mabni hoti hai.Identify the inverted hammer's nose. The nose is the center point of the candle's body. If the closing price is higher than the opening price, it indicates a bullish trend. If the closing price is lower than the opening price, it indicates a bearish signal.If you have an Inverted Hammer and a nose, you can use them as entry points for traders. Bullish Inverted Hammer is used for long positions, while bearish Inverted Hammer is used for short positions. The trading strategy includes stop loss and take profit levels. Stop loss, trader ko nuksan se bachane mein madad karta hai, whereas take profit level se faida nikala ja sakta hai.
Advantages
The Inverted Hammer trading strategy targets potential trend reversals in the market. The bullish Inverted Hammer indicates an uptrend, whereas the bearish Inverted Hammer indicates a downtrend.Inverted Hammer trading strategy is asaan or samajhne mein asan. Inverted hammer and nose are used to identify traders.When traders set stop loss and take profit levels, they gain control over their trading. Is tarah risk management ka bhi acha ho jata?
Inverted Hammer Candlestick is a candlestick pattern that appears in technical analysis. Ye pattern usually appears at market bottoms or reversal points, particularly during a downtrend.
Inverted Hammer Candlestick is a single candlestick with a body, wick, and tail. Here are the key points of the pattern:
Appearance: Inverted Hammer Candlestick ka appearance ek hammer jaisa hota hai, jismein lambi wick upper side mein hoti hai, chhoti si body lower side mein. Body colors are usually green or red.
Signal: Inverted Hammer Candlestick provides a reversal signal, especially when the downtrend has reached its bottom. Iska matlab hai ke sellers initially control mein hote hain, but phir buyers ne price ko upar le jata hai, indicating a possible trend reversal.Confirmation: If a pattern is confirmed, traders can use various technical indicators. Jaise volume analysis ya fir doosre candlestick patterns ka dekhna.
Stop Loss and Take Profit: Is pattern ko istemal karte, where traders can set their stop loss and take profit levels. Isse unka risk management is improving.
Market Context: The significance of Inverted Hammer Candlestick depends on the market context. If a strong support level approaches, or if a major trend line passes, its significance will be reduced.
The Inverted Hammer Candlestick can help traders identify potential trend reversals and create profitable trading opportunities. Similarly, is pattern ko sirf ek piece of puzzle ke taur par dekha jana chahiye, and doosre factors ke saath milakar analysis karna chahiye.
Overall, the Inverted Hammer Candlestick is a powerful reversal signal that provides traders with insights into market movements. Traders use effective trading strategies and anticipate market changes.
Formation and working of this pattern
Inverted hammer candlestick pattern ka confirmation tab hota hai, jab inverted hammer candle ke baad ek bullish candle bane, jo inverted hammer candle ki high price ko cross kar. Isse pata chalta hai ki buyers ne market mein control hasil karliya hai aur trend badal gaya hai.Inverted hammer candlestick pattern trading strategy: hum inverted hammer candle ke baad entry le sakte hain, agar confirmation milta hai. Stop loss hum inverted hammer candle ki low price ya usse thoda niche rakhte hain.
Target hum inverted hammer candle ki high price, ya usse thoda upar rakhsakte hain. If the market is volatile, then set a trailing stop loss. Here is an example of an inverted hammer candlestick pattern. According to the chart, the market is in a downtrend, and the bearish candle is followed by an inverted hammer candle. Is the body of the candle green? Upper shadow body se kafi lamba hai, whereas lower shadow nahi. Is candle ke baad, ek bullish candle banta hai, jo inverted hammer candle ki high price ko cross karta.
Isse confirmation milta hai, ki market mein tezi ayi hai. Hum is candle ke baad entry le sakte hain, aur stop loss inverted hammer candle ki low price ya usse thoda niche rakhte hain. Target hum inverted hammer candle ki high price, ya usse thoda upar rakhsakte hain.The inverted hammer candlestick pattern indicates a market trend reversal. Isse hum market mein tezi ke fayda utha sakte hain. The inverted hammer candlestick pattern can indicate a false signal. Isliye humein confirmation ka intezar karna chahiye or stop loss ka istemal karna chahiye. The inverted hammer candlestick pattern is a powerful and profitable pattern to trade. Is pattern ko pehchanne or samajhne ke liye, humein candlestick ke basic elements and market psychology ki knowledge honi chahiye. Is pattern se hum market mein tezi ka anuman laga sakte hain, apne trading mein behtar results pa sakte hain.
Dear me, umeed krta ho ap thek ho gye aj js pattern pr hm baat krien gye where he inverted hammer candlestick patterns The Inverted hammer candlestick pattern is a bullish reversal pattern that occurs on a downtrending chart. Is pattern ka matlab, then market mein tezi aane wali hai. Is pattern ka samajhne ke liye, humein candlestick ke do hisse, body aur shadow, ke bare mein pata hona chahiye.Body: Body candlestick ka wo hissa hai, jo opening & closing price ke beech mein banta. If the opening and closing prices are the same, then the body is either red or black. I'm seeing a bearish candle. Agar closing price opening price se zyada hai, body ka rang green or white hota hai.
I see a bullish candle.Shadow: Shadow candlestick ka wo hissa hai, body se upar ya niche nikalta hai. Price ranges from high to low. Agar shadow body se upar hai; to use upper shadow, wick kehte hain. If the shadow body has a niche, use the lower shadow for the tail. The inverted hammer candlestick pattern appears when the market is in a downtrend and there is a bearish candle. The body of an inverted hammer candle is visible, but the lower shadow is not. Upper shadow body se do guna, and usse zyada lamba hota hai. Buyers are putting pressure on the market, and high prices are causing problems. Sellers have fewer options, and prices are more niche. Buyers' opening price se zyada closing price banaya hai, which is a bullish sign.
Candlestick Chart and Inverted Hammer Explanation
Candlestick charts are used for trading and market analysis. Inverted Hammer is a candlestick pattern that indicates a market trend reversal. Nose trade execution, which is a pattern-based trading strategy, helps traders understand market dynamics.
Inverted Hammer is a reversal candlestick pattern that signals the market's bearish trend. Iski pehchan lambi upper shadow aur chhoti body ke zariye hoti hai, jo ki market mein buyers and sellers ke darmiyan taqat ka tasawwur deti. If the opening and closing prices of a pattern are close to each other, then the high price will be in the upper shadow.
Definition of an Inverted Hammer Candlestick.
Inverted Hammer candlestick pattern trading mein focus hota hai. Inverted Hammer body ke center point par, jo ke nose kehlata hai. If the closing price is higher than the opening price, it is a bullish signal; otherwise, it is a bearish signal.Pehle traders ko Inverted Hammer se pehchanne ki zarurat hai. Iski pehchan upper shadow ki lambai & body ki chhotai par mabni hoti hai.Identify the inverted hammer's nose. The nose is the center point of the candle's body. If the closing price is higher than the opening price, it indicates a bullish trend. If the closing price is lower than the opening price, it indicates a bearish signal.If you have an Inverted Hammer and a nose, you can use them as entry points for traders. Bullish Inverted Hammer is used for long positions, while bearish Inverted Hammer is used for short positions. The trading strategy includes stop loss and take profit levels. Stop loss, trader ko nuksan se bachane mein madad karta hai, whereas take profit level se faida nikala ja sakta hai.
Advantages
The Inverted Hammer trading strategy targets potential trend reversals in the market. The bullish Inverted Hammer indicates an uptrend, whereas the bearish Inverted Hammer indicates a downtrend.Inverted Hammer trading strategy is asaan or samajhne mein asan. Inverted hammer and nose are used to identify traders.When traders set stop loss and take profit levels, they gain control over their trading. Is tarah risk management ka bhi acha ho jata?
Inverted Hammer Candlestick is a candlestick pattern that appears in technical analysis. Ye pattern usually appears at market bottoms or reversal points, particularly during a downtrend.
Inverted Hammer Candlestick is a single candlestick with a body, wick, and tail. Here are the key points of the pattern:
Appearance: Inverted Hammer Candlestick ka appearance ek hammer jaisa hota hai, jismein lambi wick upper side mein hoti hai, chhoti si body lower side mein. Body colors are usually green or red.
Signal: Inverted Hammer Candlestick provides a reversal signal, especially when the downtrend has reached its bottom. Iska matlab hai ke sellers initially control mein hote hain, but phir buyers ne price ko upar le jata hai, indicating a possible trend reversal.Confirmation: If a pattern is confirmed, traders can use various technical indicators. Jaise volume analysis ya fir doosre candlestick patterns ka dekhna.
Stop Loss and Take Profit: Is pattern ko istemal karte, where traders can set their stop loss and take profit levels. Isse unka risk management is improving.
Market Context: The significance of Inverted Hammer Candlestick depends on the market context. If a strong support level approaches, or if a major trend line passes, its significance will be reduced.
The Inverted Hammer Candlestick can help traders identify potential trend reversals and create profitable trading opportunities. Similarly, is pattern ko sirf ek piece of puzzle ke taur par dekha jana chahiye, and doosre factors ke saath milakar analysis karna chahiye.
Overall, the Inverted Hammer Candlestick is a powerful reversal signal that provides traders with insights into market movements. Traders use effective trading strategies and anticipate market changes.
Formation and working of this pattern
Inverted hammer candlestick pattern ka confirmation tab hota hai, jab inverted hammer candle ke baad ek bullish candle bane, jo inverted hammer candle ki high price ko cross kar. Isse pata chalta hai ki buyers ne market mein control hasil karliya hai aur trend badal gaya hai.Inverted hammer candlestick pattern trading strategy: hum inverted hammer candle ke baad entry le sakte hain, agar confirmation milta hai. Stop loss hum inverted hammer candle ki low price ya usse thoda niche rakhte hain.
Target hum inverted hammer candle ki high price, ya usse thoda upar rakhsakte hain. If the market is volatile, then set a trailing stop loss. Here is an example of an inverted hammer candlestick pattern. According to the chart, the market is in a downtrend, and the bearish candle is followed by an inverted hammer candle. Is the body of the candle green? Upper shadow body se kafi lamba hai, whereas lower shadow nahi. Is candle ke baad, ek bullish candle banta hai, jo inverted hammer candle ki high price ko cross karta.
Isse confirmation milta hai, ki market mein tezi ayi hai. Hum is candle ke baad entry le sakte hain, aur stop loss inverted hammer candle ki low price ya usse thoda niche rakhte hain. Target hum inverted hammer candle ki high price, ya usse thoda upar rakhsakte hain.The inverted hammer candlestick pattern indicates a market trend reversal. Isse hum market mein tezi ke fayda utha sakte hain. The inverted hammer candlestick pattern can indicate a false signal. Isliye humein confirmation ka intezar karna chahiye or stop loss ka istemal karna chahiye. The inverted hammer candlestick pattern is a powerful and profitable pattern to trade. Is pattern ko pehchanne or samajhne ke liye, humein candlestick ke basic elements and market psychology ki knowledge honi chahiye. Is pattern se hum market mein tezi ka anuman laga sakte hain, apne trading mein behtar results pa sakte hain.
Dear me, umeed krta ho ap thek ho gye aj js pattern pr hm baat krien gye where he inverted hammer candlestick patterns The Inverted hammer candlestick pattern is a bullish reversal pattern that occurs on a downtrending chart. Is pattern ka matlab, then market mein tezi aane wali hai. Is pattern ka samajhne ke liye, humein candlestick ke do hisse, body aur shadow, ke bare mein pata hona chahiye.Body: Body candlestick ka wo hissa hai, jo opening & closing price ke beech mein banta. If the opening and closing prices are the same, then the body is either red or black. I'm seeing a bearish candle. Agar closing price opening price se zyada hai, body ka rang green or white hota hai.
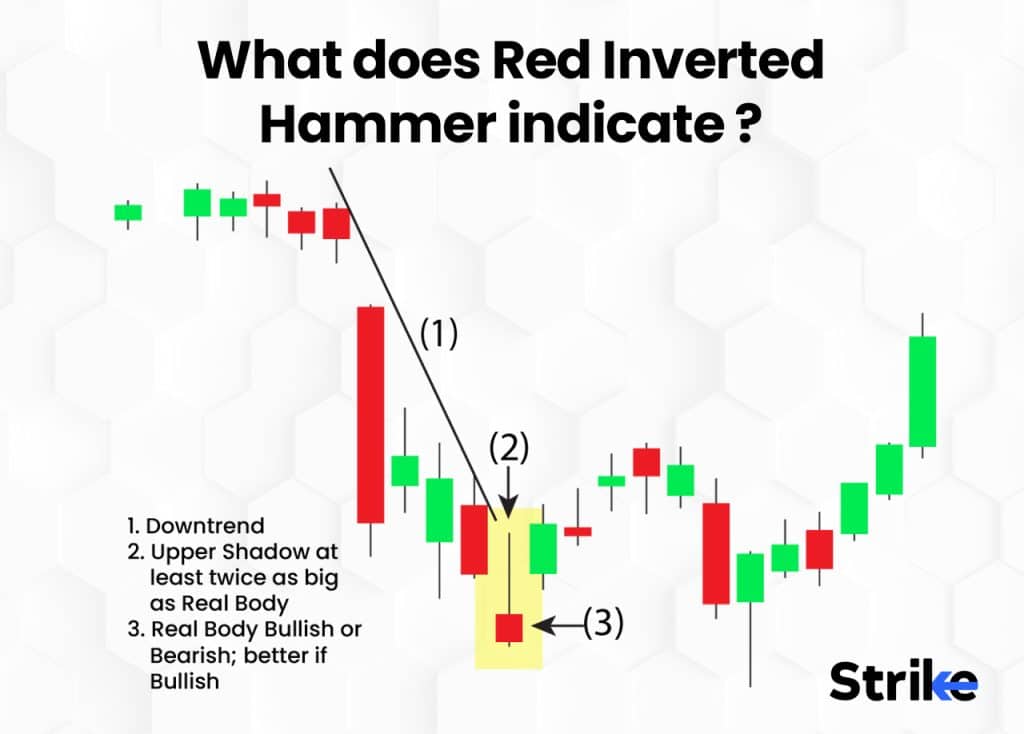
I see a bullish candle.Shadow: Shadow candlestick ka wo hissa hai, body se upar ya niche nikalta hai. Price ranges from high to low. Agar shadow body se upar hai; to use upper shadow, wick kehte hain. If the shadow body has a niche, use the lower shadow for the tail. The inverted hammer candlestick pattern appears when the market is in a downtrend and there is a bearish candle. The body of an inverted hammer candle is visible, but the lower shadow is not. Upper shadow body se do guna, and usse zyada lamba hota hai. Buyers are putting pressure on the market, and high prices are causing problems. Sellers have fewer options, and prices are more niche. Buyers' opening price se zyada closing price banaya hai, which is a bullish sign.
تبصرہ
Расширенный режим Обычный режим